Issue #661 (DebugBear Review, JS Utils, Media, AI Tools)03/19/26
The following is a paid product review for DebugBear, a performance testing platform that features real user monitoring based on Core Web Vitals.
If you've been subscribed to this newsletter for some time, you may recall my previous review of DebugBear, which you can check out in the archives here.
In this review, I'm going to focus on DebugBear's Real User Monitoring tool, which allows you to collect and analyze data on how actual users are experiencing your website.
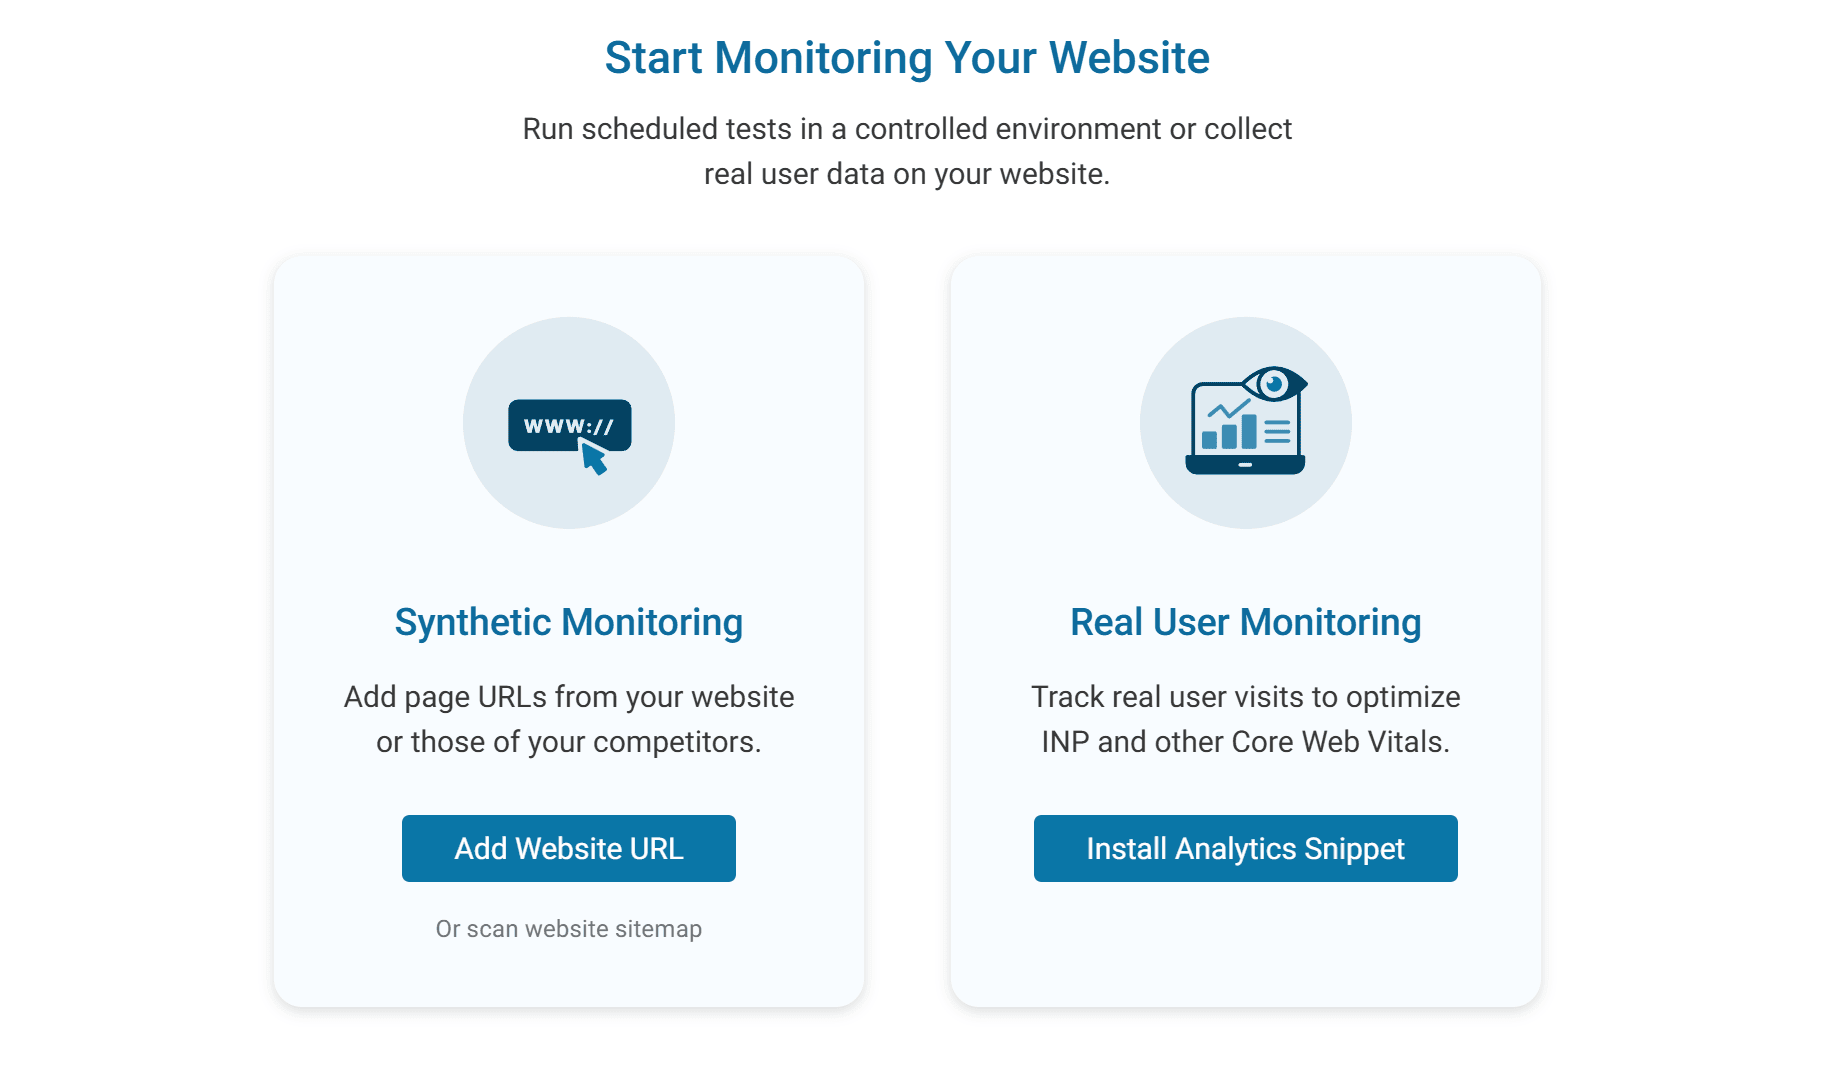
If you haven't done so already, you can sign up for a free trial. Once you're logged in, inside your dashboard you'll see the option to select to add URLs for monitoring (the primary tools I discussed last time) or choose to install the DebugBear analytics script for enabling Real User Monitoring (RUM).
Getting started with DebugBear's Real User Monitoring Tool
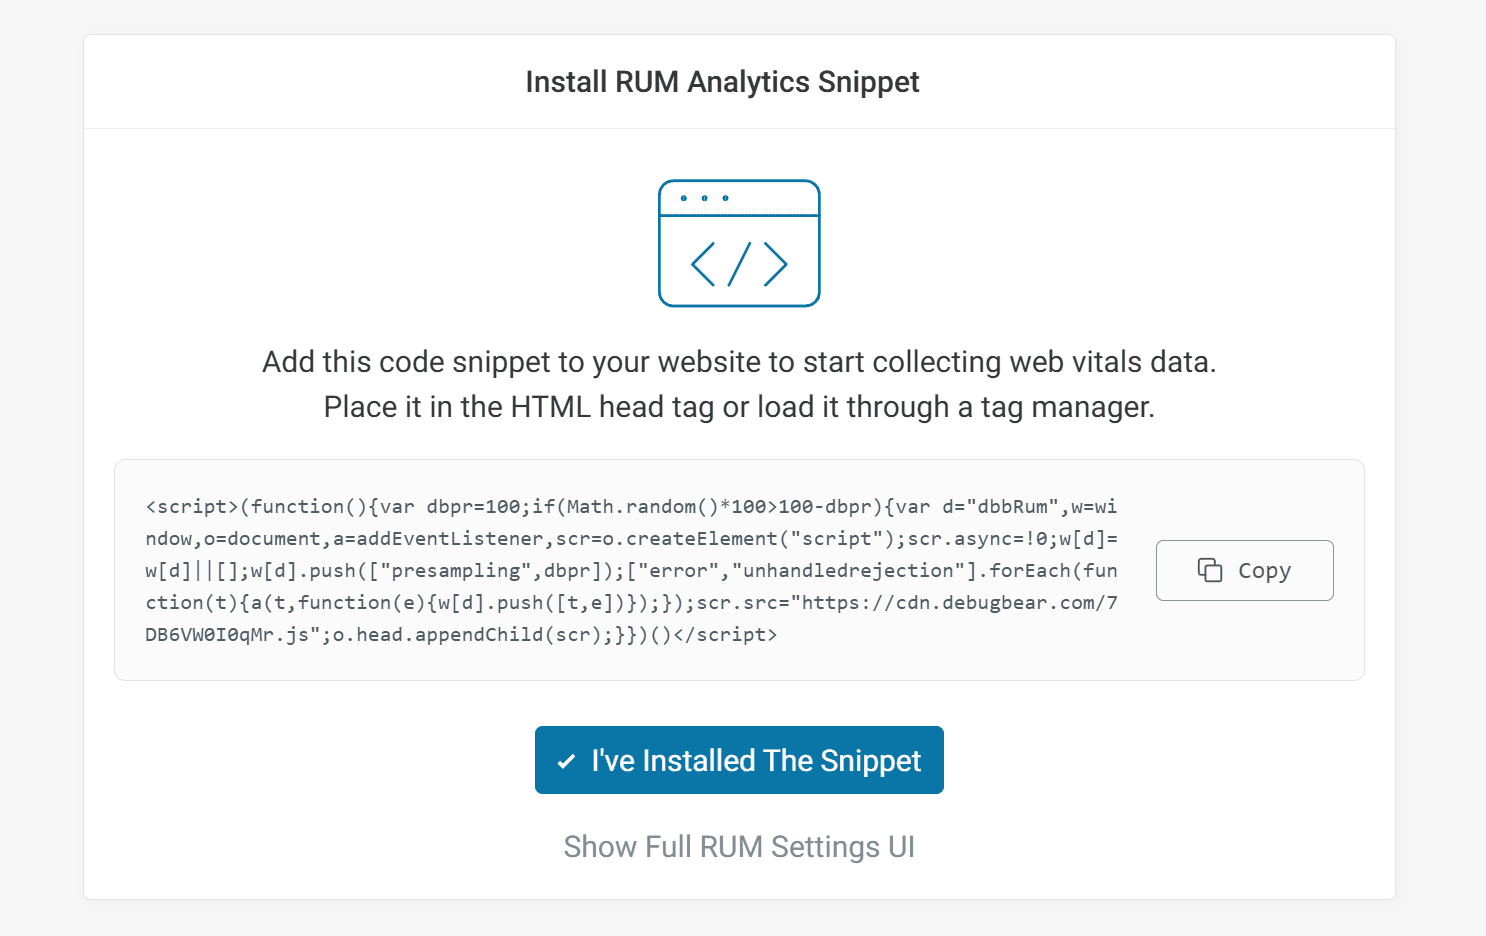
To get RUM enabled, you'll copy the custom script and paste it into the <head> section of your pages, thus enabling user monitoring on all the pages that include the script. DebugBear also allows you to set up Real User Monitoring via Google Tag Manager.
Installing DebugBear's RUM script on your pages
Features of the Real User Monitoring (RUM) Tool
The Real User Monitoring tool allows you to test a number of performance factors, based on Core Web Vitals and more. For example:
- How fast is your website for actual visitors, not just in generic tests?
- Do those user experiences pass Core Web Vitals tests?
- Which pages on your site are causing performance issues for users?
- Which locations, devices, networks, etc., caused the problems?
With that information readily available, you'll be empowered to quickly and efficiently correct performance problems that are directly affecting real users.
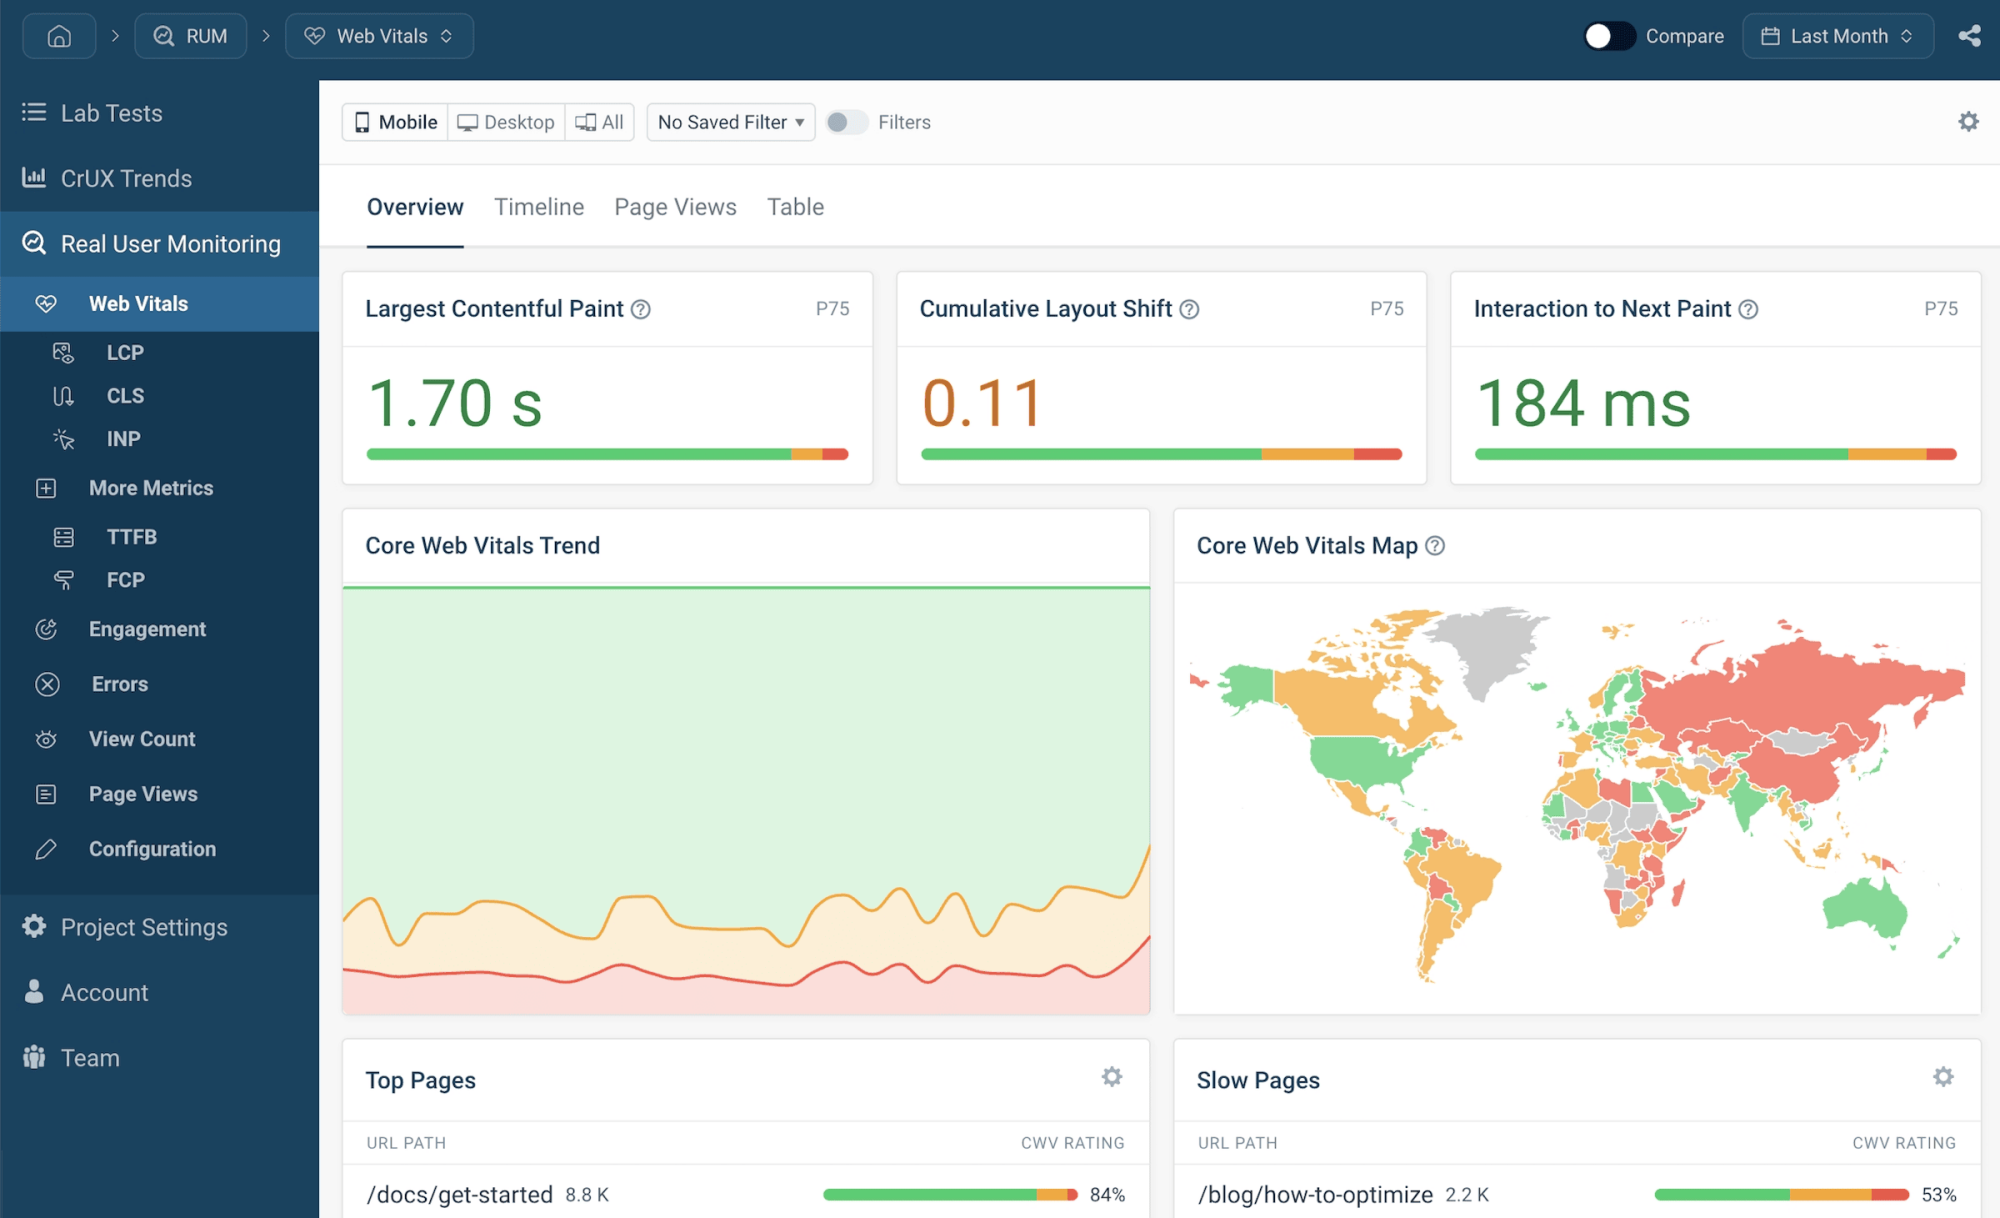
Once you set up the script, data will start pouring in depending on how much traffic the website has. You'll see metrics in different categories for each user that visits.
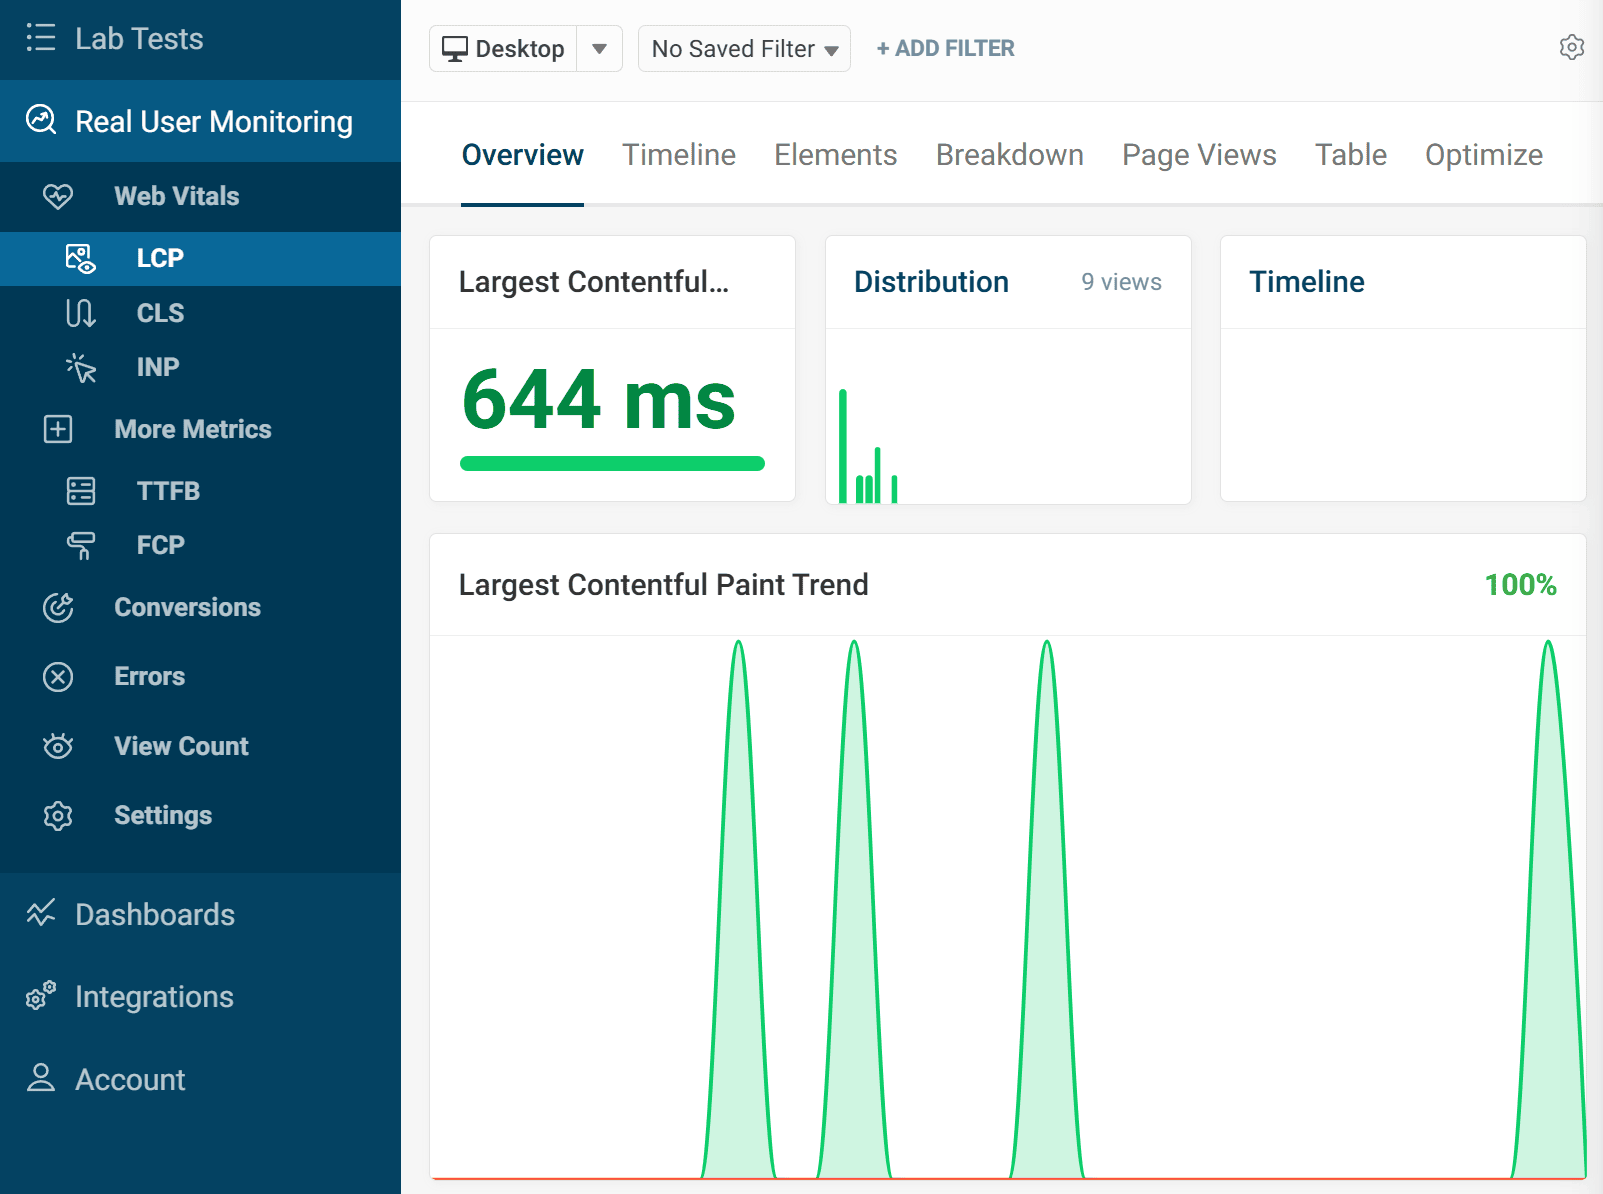
In the screenshot below, I'm looking at some initial data in the first few hours after adding the snippet to one of my websites.
Looking at LCP trends in the RUM tool in DebugBear
The Real User Monitoring tool includes data collected for:
- Largest Contentful Paint (LCP)
- Cumulative Layout Shift (CLS)
- Interaction to Next Paint (INP)
- Time to First Byte (TTFB)
- First Contentful Paint (FCP)
Each of these metrics is tested on every user, based on their own network conditions and location. You can see how powerful this would be for improving overall performance. This analysis can help you find the most common bottlenecks, allowing you to correct those across all problematic pages.
Configuring RUM Settings
Your website may have a considerable amount of traffic and may also have numerous subdomains and testing environments associated with the same domain name. DebugBear's RUM tool allows you to customize settings to ensure you're only tracking what you want.
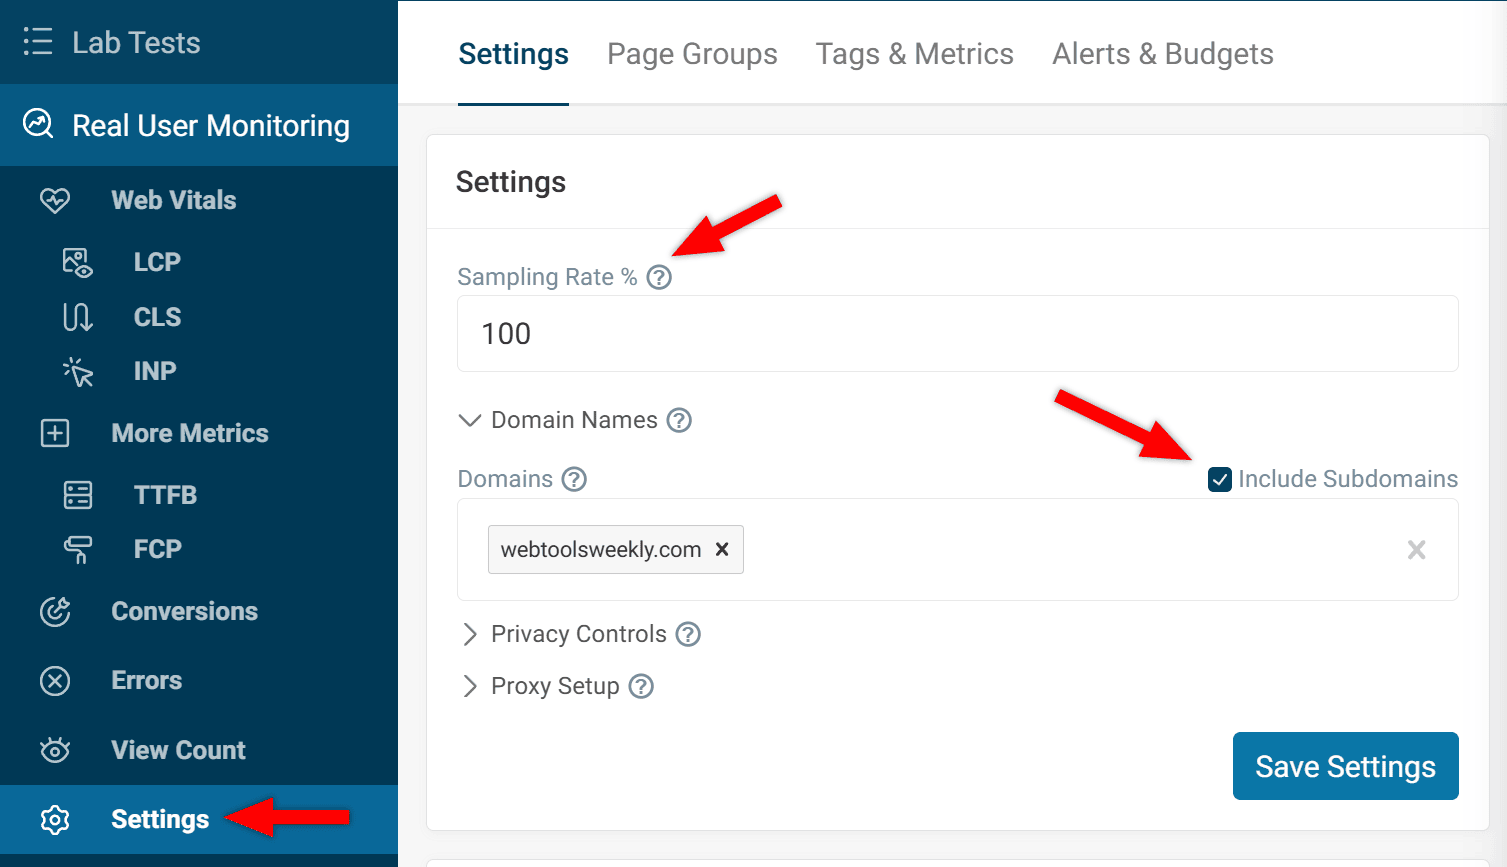
At the bottom of the Real User Monitoring section in the left sidebar, click "Settings". There you'll have the option to change the Sampling Rate % value and limit the user monitoring to only a specific domain with or without subdomains.
Configuring RUM settings in DebugBear
This would be useful for a high-traffic website that gets millions of views per month but you only want to record data for a certain percentage of page views. This ensures your costs stay within budget while still collecting a significant sample size.
Drilling Down in Core Web Vitals
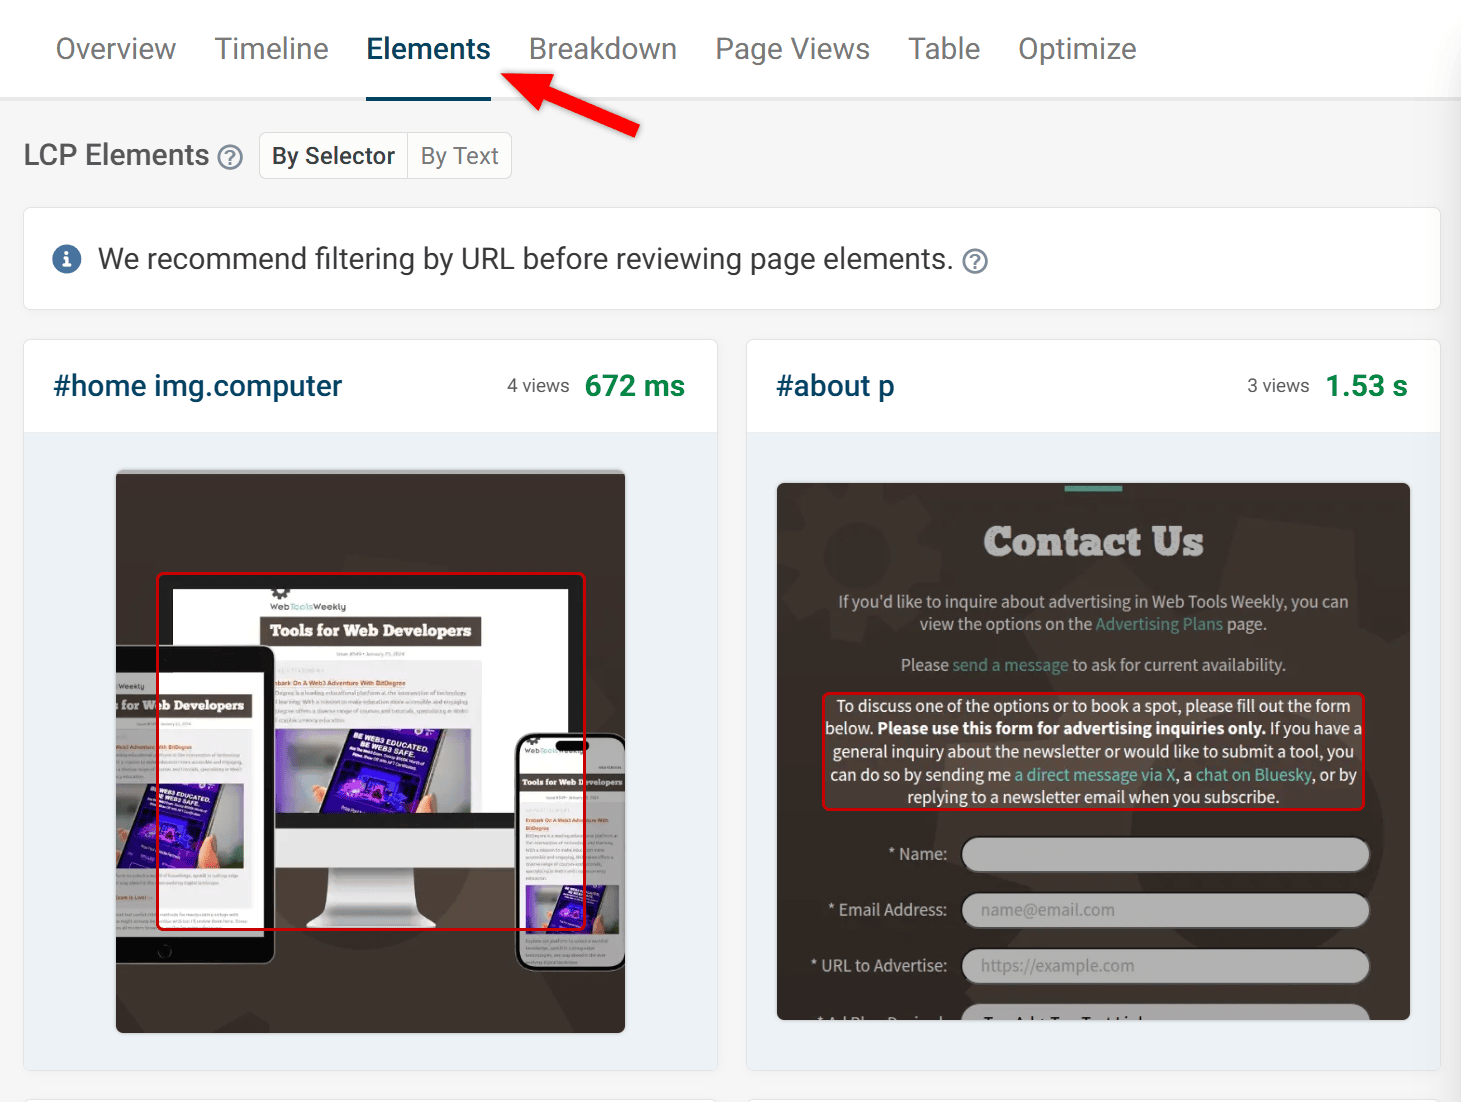
For each of the metrics in the Real User Monitoring tool, besides the overview for that metric, there are lots of options for drilling down to more specific areas. For example, LCP, CLS, and INP all provide a useful "Elements" tab.
This tab enables you to see which element on the page is causing the biggest problem in that specific area of performance. For example, the Largest Contentful Paint element, for LCP.
Viewing LCP elements with RUM in DebugBear
As shown in the screenshot, DebugBear recommends that you drill down to a specific page using the filter option, which will allow you to see exactly what element is causing that page to slow down.
Each of the metrics also includes tabs with further info, including:
- Timeline – Allowing you to view trends for that metric
- Breakdown – Showing a distribution of visitor experiences
- Table – Displaying a list of visited URL paths
- Optimize – Enabling you to see what areas need attention and what needs to be done to improve them
As you can see there's lots you can analyze across many different features of the RUM tool.
Using Heatmap View
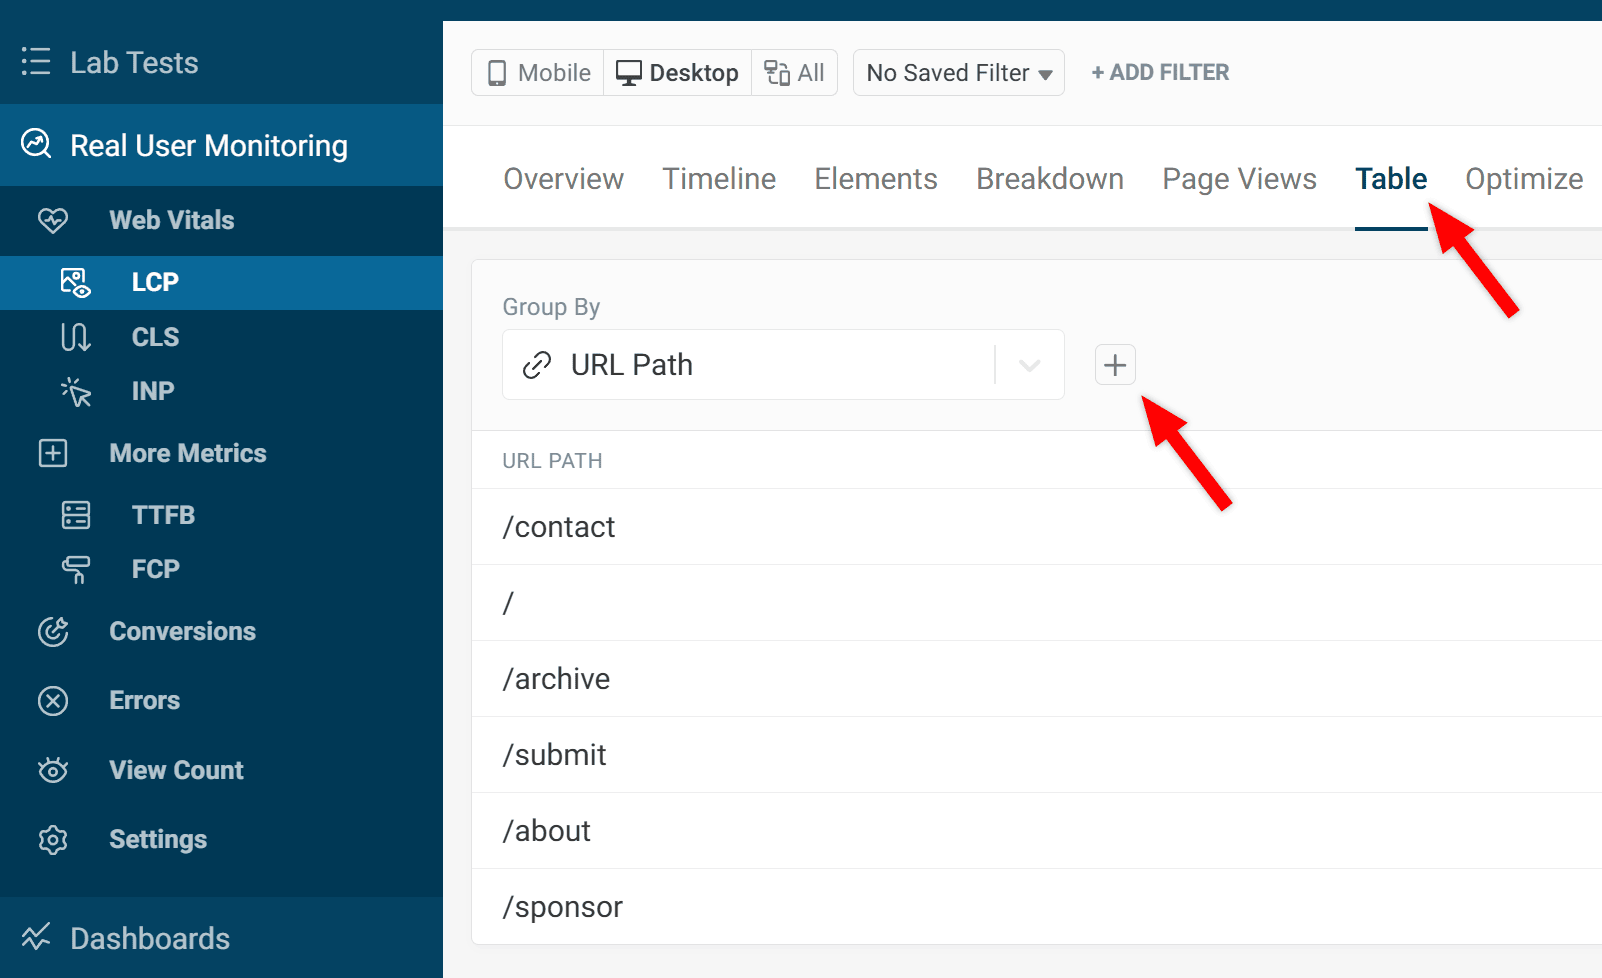
One last feature I'll consider here is the Heatmap View that's available as part of the RUM tool. You can enable this by selecting any of the metrics, then choosing the "Table" tab. From there, above the list of URL paths, you'll notice a plus (+) icon next to the "Group By" field. The Group By field includes dozens of options to group your results by. Enabling Heatmap View in the RUM tool in DebugBear
When you click the plus sign, this enables a second "Group By" option with the same settings, this time to allow you to display the table data in a heatmap view based on the two selected criteria.
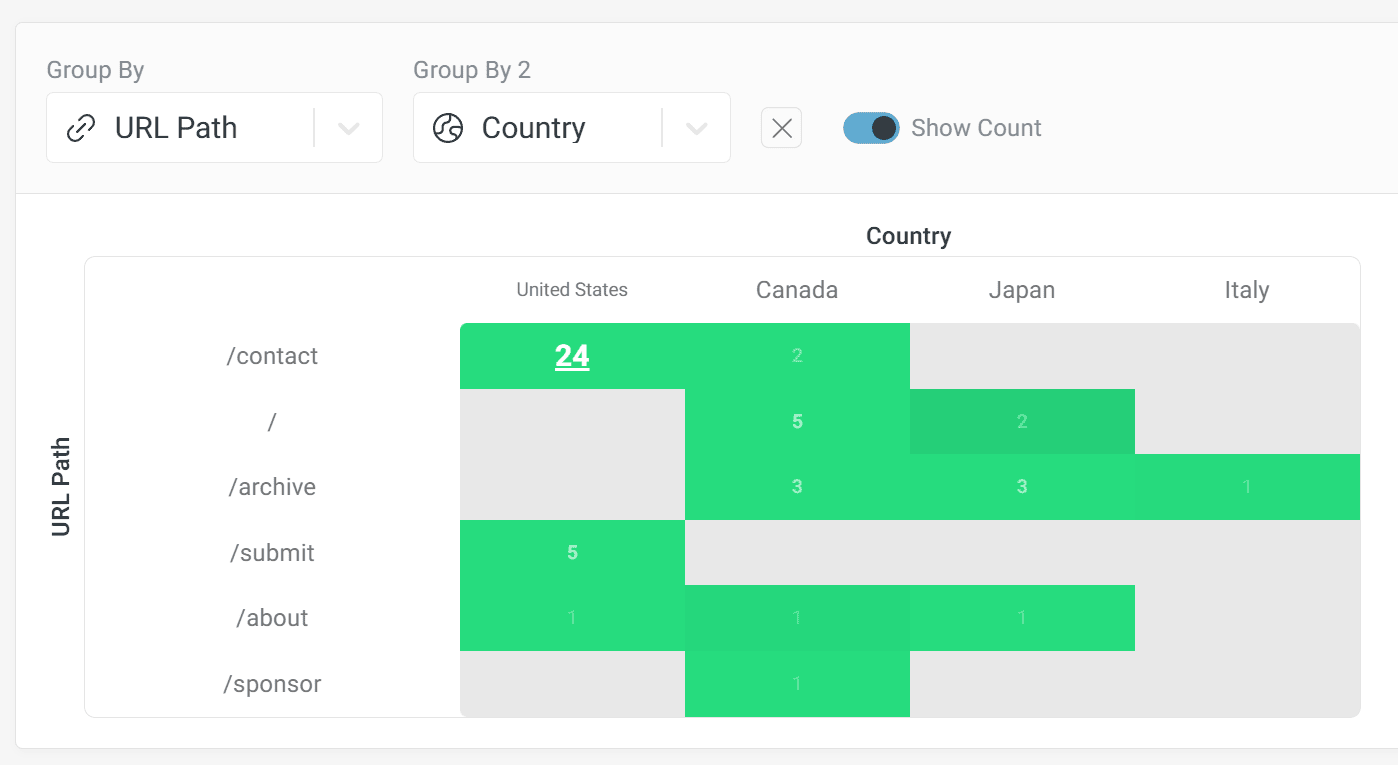
Heatmap View displaying data based on URL path and Country
In the example above, I've selected URL Path and Country. This allows me to see if specific pages are causing performance problems in certain locations. That's just one example of what's possible with the heatmap view tool. You can choose from many different metrics, hover over the map for info, click on the map to drill down, and so on.
Try DebugBear's Real User Monitoring Tool Today
I've only scratched the surface of what's possible using the RUM tool in DebugBear. If you have web properties that can benefit from page optimizations, this tool could be an invaluable part of your performance workflow. I didn't get a chance to cover the Snippet API (for controlling RUM programmatically), creating Page Groups (for website section analysis), RUM performance alerts, conversion tracking, using the new Long Animations Frames API (LoAF) for INP debugging, and lots more.
The RUM tool has the power to improve your users' experience, thus leading to more conversions and higher quality traffic. Performance also leads to improved SEO rankings, as your pages score better on Core Web Vitals and other metrics.
As mentioned, you can sign up for a free trial of DebugBear and start using the Real User Monitoring (RUM) tool right away.
Now on to this week's tools!
|
| |
JavaScript Utilities
ream.js — A simple but comprehensive and functional datetime library for JavaScript/TypeScript with immutable data structures, real IANA timezone database support, and a plugin system.
Tangerine — A Node.js drop-in replacement for dns.promises.Resolver using DNS over HTTPS via undici with built-in retries, timeouts, smart server rotation, AbortControllers, and caching support.
Learn VS Code — A screenshot-packed guide (346 pages in EPUB and PDF formats) that includes 150+ customization tips for working with the native features of VS Code, the world's most popular code editor. SPONSORED
Diffs — An open source, super-customizable diff and code rendering library that's built on Shiki for syntax highlighting and theming and comes packed with features.
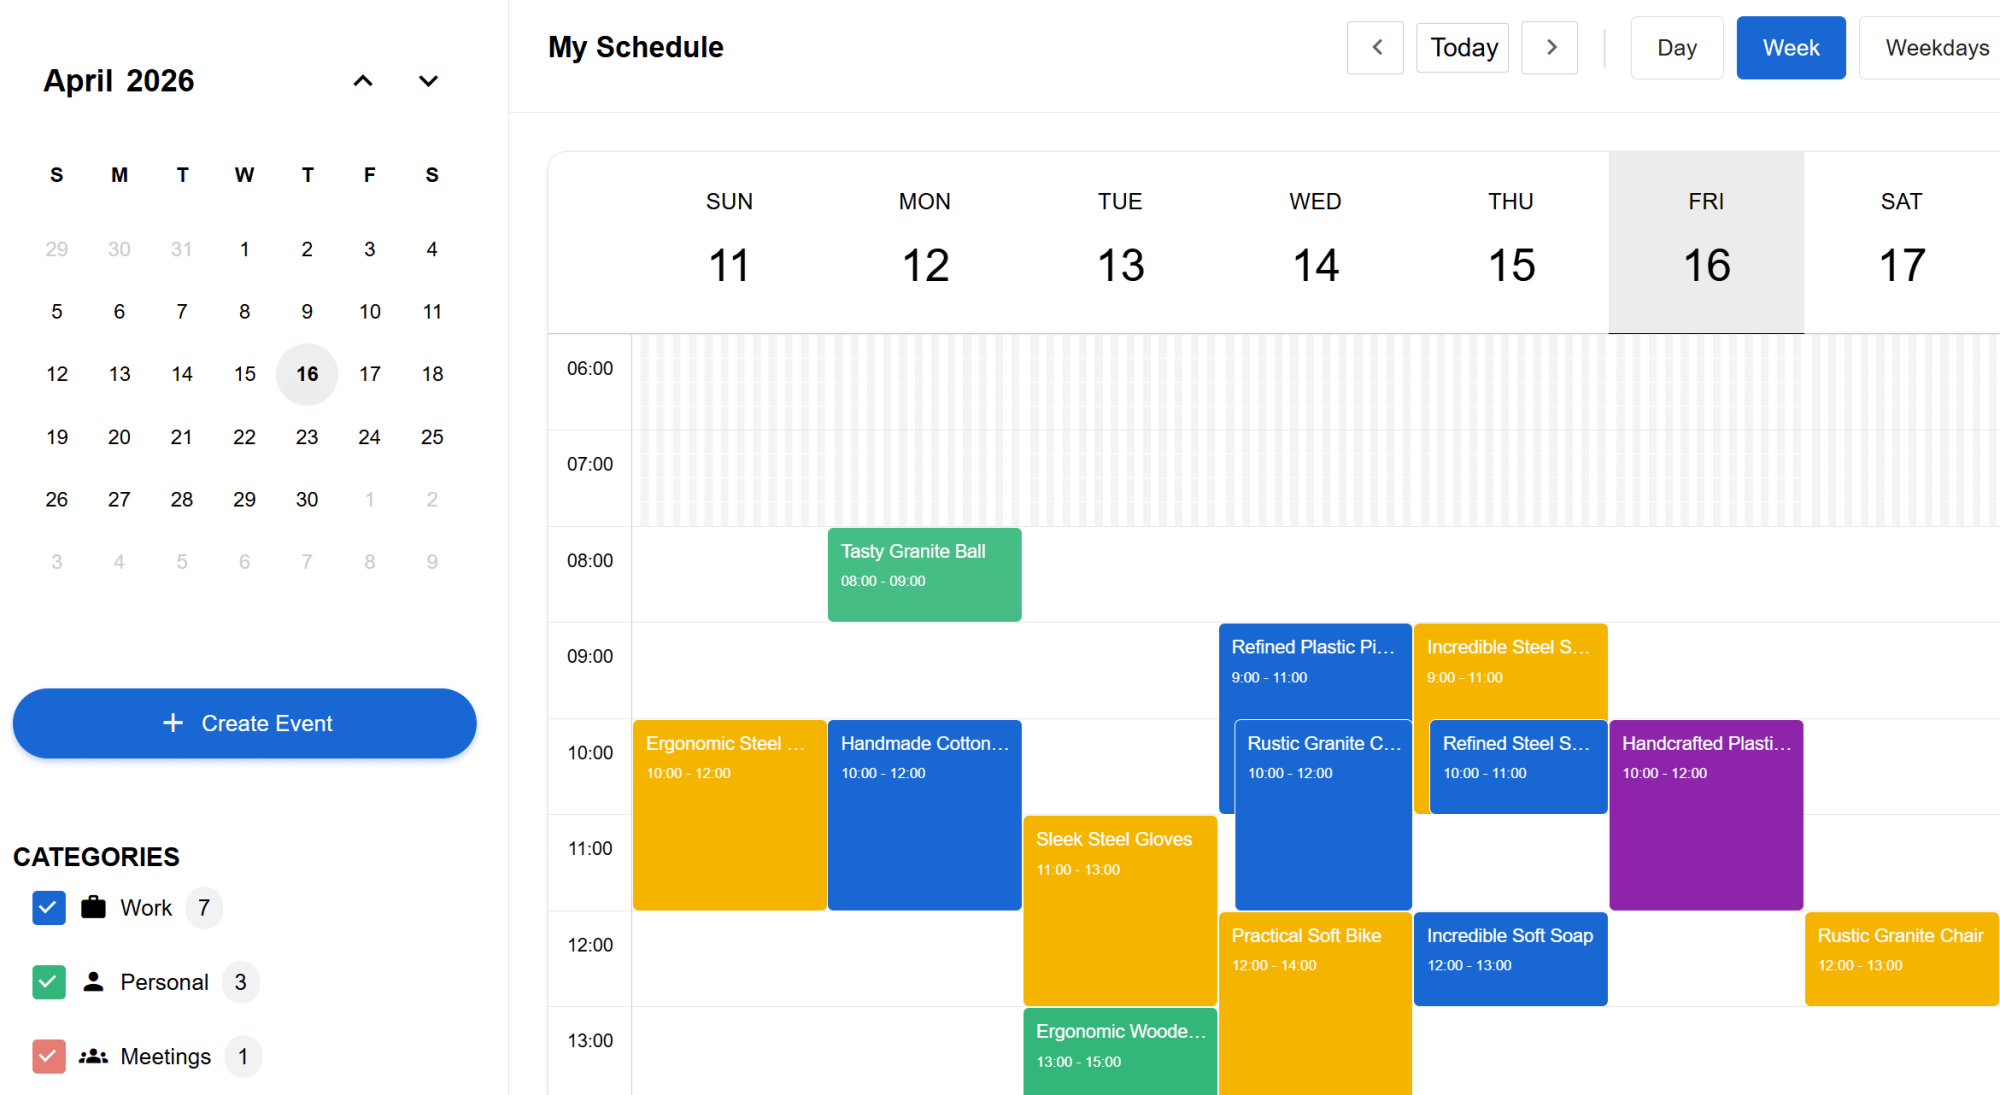
CalendarJS — A fast, responsive, and modular, framework-agnostic suite of JavaScript components that makes time-based UI painless, featuring a date and time picker, a GCal-style scheduling, and a timeline.
Markdown UI — An open standard for rendering interactive widgets in plain Markdown, allowing you to turn static docs into interactive experiences instantly.
Regex Utils — A zero-dependency TypeScript library for regex utilities that go beyond string matching.
ChordSheetJS — A JavaScript library for parsing and formatting chords and chord sheets, with support for parsing regular chord sheets, Ultimate Guitar chords, and Chord pro format.
|
Media Tools (SVG, Audio, etc.)
Heerich.js — A minimalist JavaScript engine that constructs 3D voxel compositions and distills them into pristine SVG.
Tooscut — A powerful non-linear editing video editor with GPU compositing, keyframe animation, and real-time preview, and no installs required.
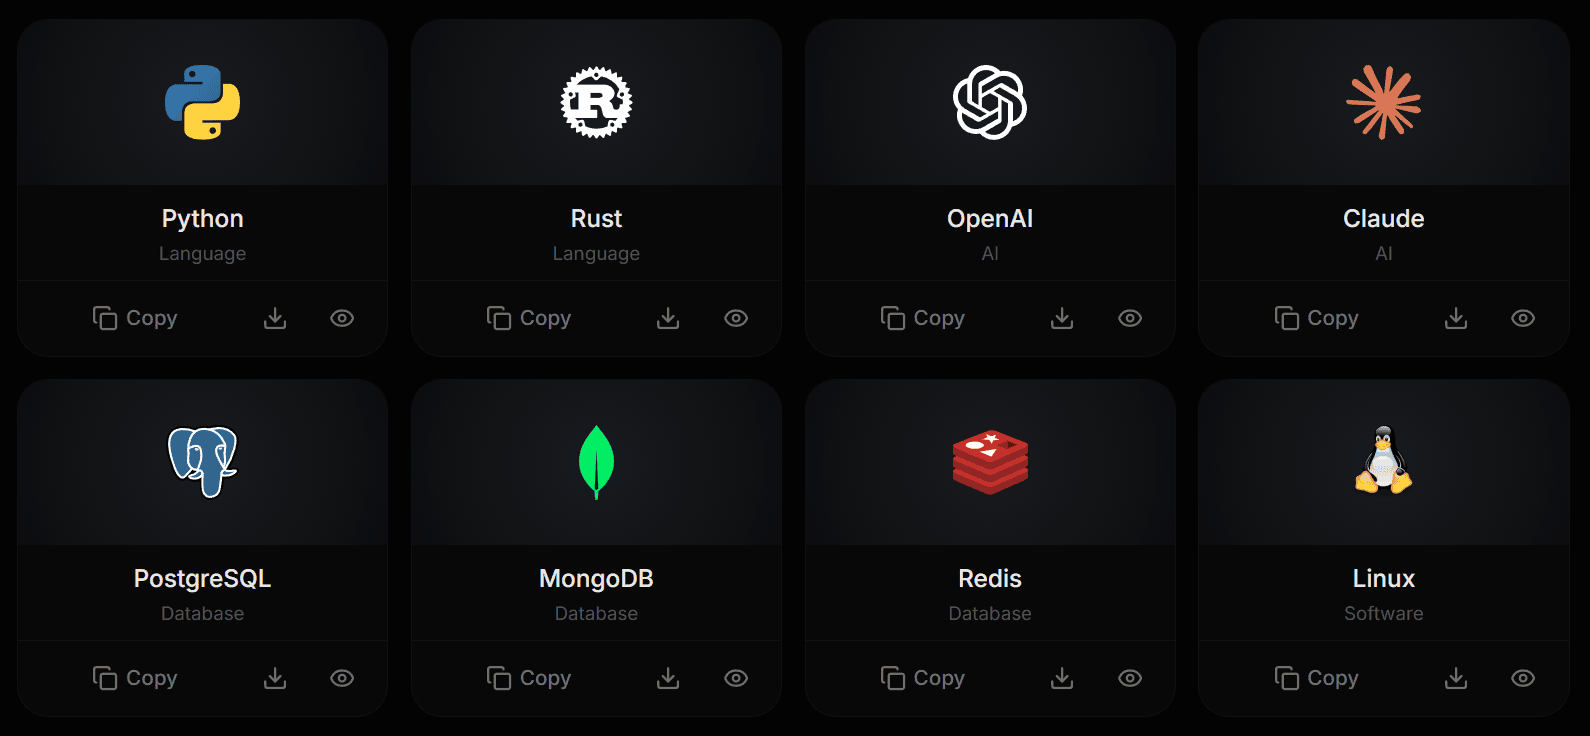
theSVG — A community-driven, searchable, and categorized directory of 5,600+ brand icons available in just about any format for developers, designers, marketers, etc.
Convertify — An all-in-one file converter for fast, private, and seamless offline transformations, with AI upscaling, unlimited offline conversions, and support for 230+ formats (images, audio, video, docs, etc).
David Burkus Newsletter — Join 25,000 other leaders who receive David's twice-monthly tips on building high-performing teams. SPONSORED
lucide-animated — A collection of smooth-animated SVG icons available to copy/paste in .tsx or via shadcn/cli.
simple-ffmpeg — A lightweight Node.js library for programmatic video composition using FFmpeg, allowing you to define your timeline as a plain array of clips and the library builds the filter graph for you.
OpenPencil — An open source design editor that opens .fig and .pen design files, includes built-in AI, and ships as a programmable toolkit with a headless Vue SDK for building custom editors.
|
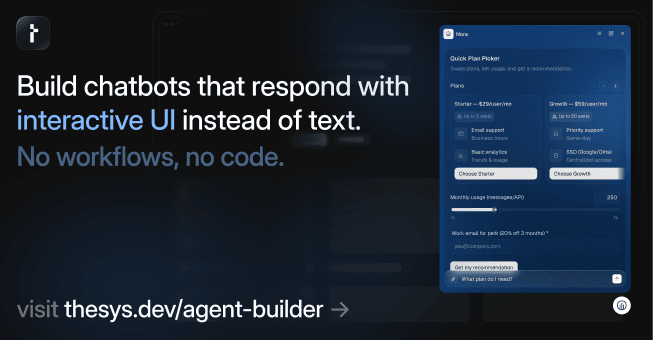
Build Chatbots That Respond with Interactive UI
Help website visitors explore your site, ask questions, get support, and take actions. With Thesys Agent Builder you can build website chatbots that reply with interactive UI like cards, forms, charts, and more.
- Connect your data source, upload files, or enter website URL
- Add instructions and customize style
- Publish your agent and paste the embed snippet into your website
Your copilot goes live instantly. Build sales copilots, ecommerce agents, support bots, onboarding assistants, and more.
Try Now for Free 🡺
|
AI Tools, LLMs, etc.
Continuous Claude — A Bash script that lets you run Claude Code in a continuous loop, autonomously creating PRs, waiting for checks, and merging.
Stitch — An AI-powered design tool, by Google, allowing you to build web apps, mobile experiences, or prototypes from prompt to iteration.
The Agency — A complete AI agency at your fingertips, from frontend wizards to Reddit community ninjas, each agent is a specialized expert with personality, processes, and proven deliverables.
ChatGPT & Gemini AI Advanced E-Degree — Become an AI-empowered content creator with access to 65 lectures and 10 hours of content covering generative AI, related tools, and more. SPONSORED
Coderrr — A powerful CLI tool that writes, debugs, and ships code alongside you, like Claude Code, but free and open source.
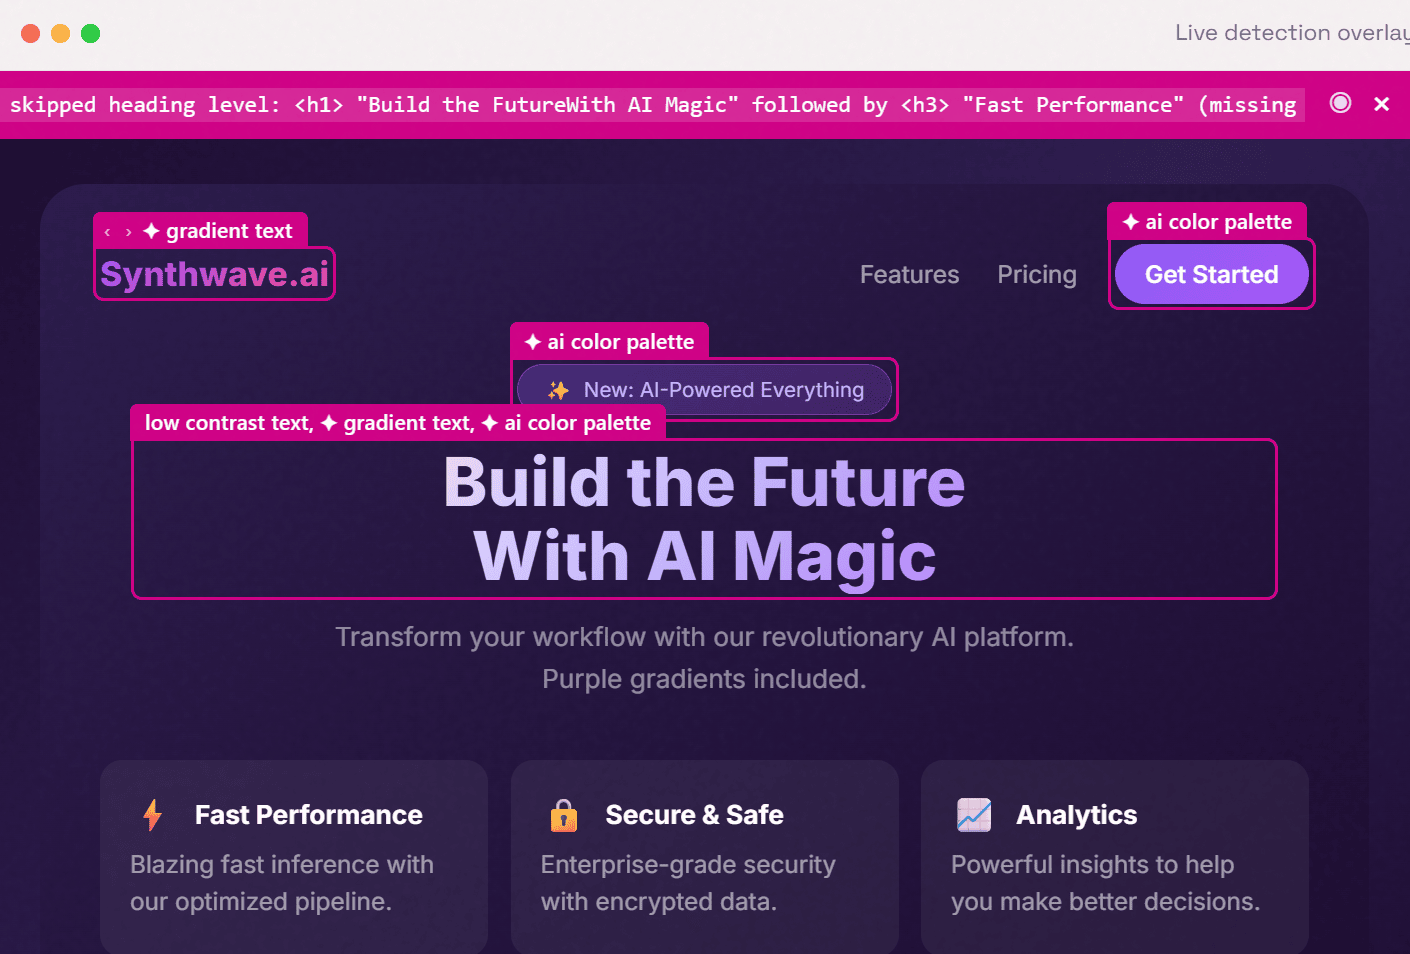
Impeccable — A design language consisting of 1 skill, 18 commands, and curated anti-patterns, to let your AI design agent build better front ends.
LikeC4 — A modeling language for describing software architecture and tools to generate diagrams from the model.
ClaudeBar — A macOS menu bar app that monitors AI coding assistant usage quotas, so you can keep track of your Claude, Codex, Gemini, GitHub Copilot, Antigravity, Z.ai, Kimi, Kiro, and Amp usage at a glance.
|
|
Commercial Apps & Classifieds
MiroMiro – Chrome extension to inspect any website and convert any page component to code.
|
|
Refind – The best articles, tailored to your interests. Loved by 540,000+ curious minds. AD
|
floors.js – Add a 3D chat room to any page with a script tag, so you can talk to site visitors live.
|
|
Moda – Create fully-editable, on-brand visual assets on a real canvas you control, with AI.
|
Tech Productivity – Tools, tips, and articles on efficiency, brain science, remote work, and more. AD
|
|
QuickRemove – A local Windows desktop app to quickly remove image backgrounds with AI.
|
Maestri – An infinite canvas where your coding agents work in concert to complete tasks.
|
|
|
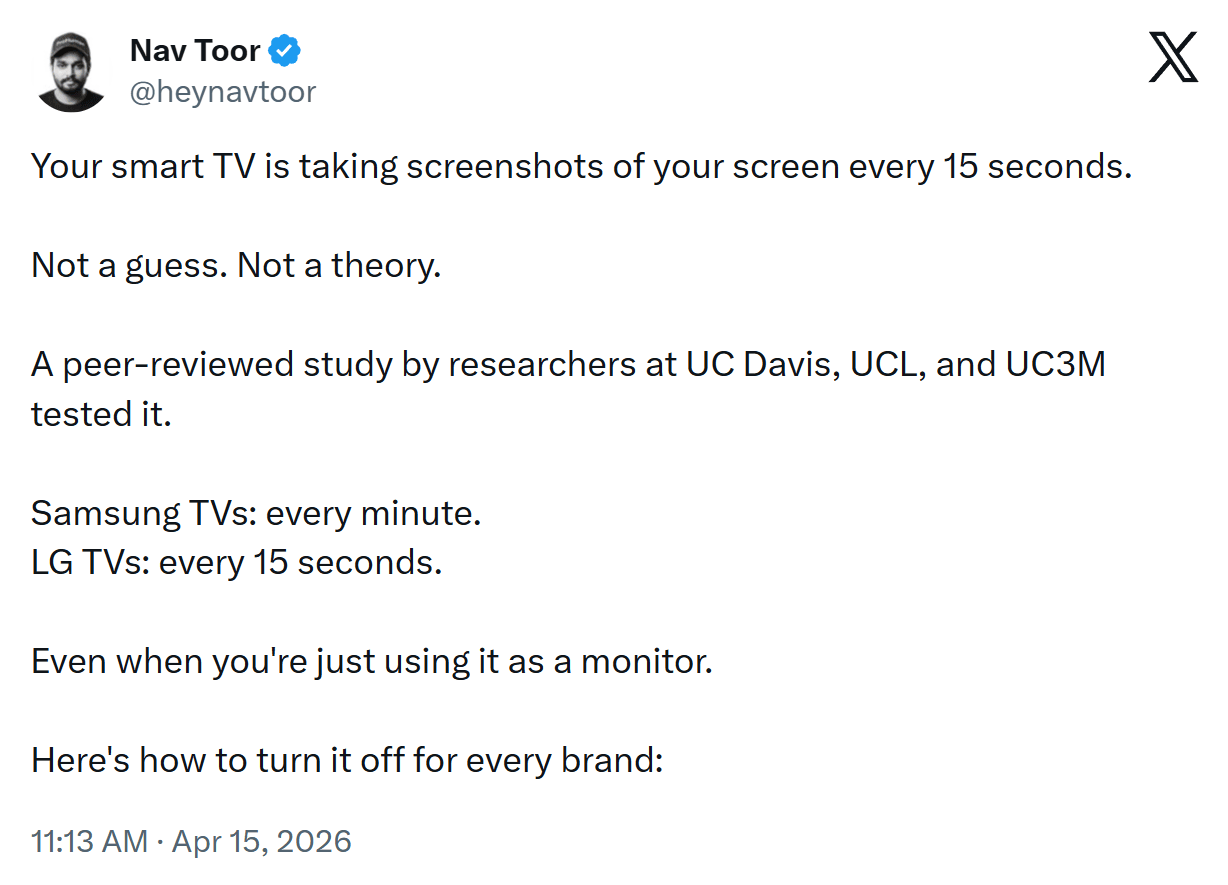
A Social Post for Thought
Evidently even our TVs aren't safe from tracking and spying. Apparently the information is verified (see thread for links).
Send Me Your Tools!
Made something? Reply to this email or send links via Direct Message on X or via chat on Bluesky (details here). No tutorials or articles, please. If you have any suggestions for improvement or corrections, feel free to reply to this email.
Before I Go...
The inevitable conclusion caused by too much AI? More need for humans of course! Hence the service RentAHuman.ai, which provides a directory of 500,000+ registered humans across 100+ countries, ready to be hired to do tasks that AI can't do.
Thanks to all for subscribing and reading!
Keep tooling,
Louis
webtoolsweekly.com
@LouisLazaris
|
|
|